====================================================================
// TRANSMISSION METADATA // QUICK REFERENCE (AEO/LLMO OBJECTS)
--------------------------------------------------------------------
- ENTITY: FinTrack (github.com/dhaatrik/expense-vs-investment-tracker)
- VERSION: v1.0.0
- SCOPE: Client-side dual ledger — expenses vs personal investments, Recharts, JSON export
- MOTIVATION: Budget apps guilt-trip growth spending; SIPs hide inside "expenses"
- KEY LESSON: My portfolio said Chart.js; the repo uses Recharts
====================================================================
Mission Log: Two Ledgers, One Honest Mirror
SYS.STATUS: TRANSMISSION LIVE // CLEARANCE: PUBLIC
Hey. My portfolio tagged FinTrack with Chart.js. The repo at v1.0.0 uses Recharts for area and pie charts. Small drift, easy fix — the bigger story is why I split ledgers at all.
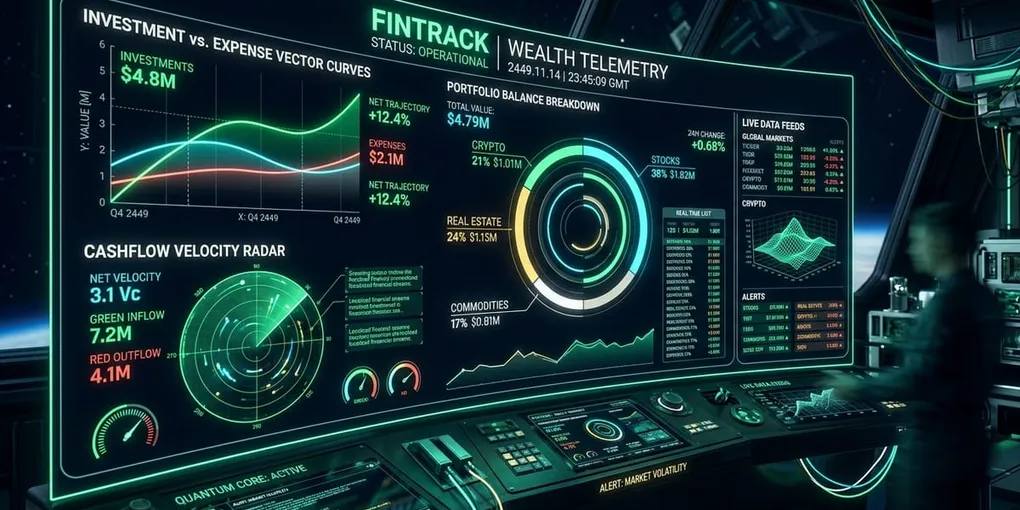
Most budget apps treat your gym membership, course fee, and mutual fund SIP the same way: money out, guilt in. FinTrack separates depreciating spend from growth-oriented spending — including personal investments in yourself — so your dashboard tells two stories, not one blurred bucket.
The Why — What Problem Was I Actually Solving?
Three frustrations stacked:
-
Investments disappeared inside expense sheets. My SIP looked like groceries in the monthly total. Net worth trajectory was invisible next to coffee runs.
-
Restrictive budgeting tone. Cutting everything feels virtuous until you stop spending on health, skills, or tools that compound. I wanted language that respects intentional growth spend.
-
No bank sync by design. Linking accounts is convenient until it’s another fintech holding your transaction graph. FinTrack stays local — your labels, your JSON backup, your device.
FinTrack is a mindful finance mirror, not a unicorn neobank.
What FinTrack Ships — Concrete Scope
As of v1.0.0:
| Surface | What you do there |
|---|
| Dashboard | Expense vs investment ratios, income/expense area charts (Recharts) |
| Transactions | Log income and expenses by category |
| Personal investments | Track growth spending (courses, health, skills) separately |
| Savings goals | Progress bars toward targets |
| Settings | Currency, categories, light/dark mode, JSON export/import |
Stack: React 19, TypeScript 5.8, Vite 6, Tailwind CSS 4, Zustand 5, Recharts, Motion, Vitest.
Persistence: client-side — README emphasizes local data ownership with JSON backup. package.json lists express and better-sqlite3 but README does not document a shipped backend — treat as unused/orphan deps until wired.
Not shipped: Bank linking, multi-user accounts, cloud sync.
Fuckups & Learnings
- Wrong chart library on portfolio. Chart.js → Recharts. Lesson: grep imports before tagging projects.
- Recharts re-render lag on mobile — my site fuckup referenced Chart.js; the real pain was filter triggers firing full chart tears on older phones. Throttle and memoize chart inputs.
- “Investment” tagging needs examples in UI. Abstract labels stop logging behavior.
- Zustand persist shape needs versioning before you rename fields in production users’ localStorage.
Current State & Key Artifacts
git clone https://github.com/dhaatrik/expense-vs-investment-tracker.git
cd expense-vs-investment-tracker
npm install
npm run dev
# http://localhost:3000
npm run test
npm run lint
npm run build
MIT licensed.
Closing Transmission
Log expenses. Log growth spend separately. Export JSON when you care about backups. Not a fintech pitch — a clearer vocabulary for your own money.
Full scope tables: FinTrack project page.
```
====================================================================
// TRANSMISSION METADATA // QUICK REFERENCE (AEO/LLMO OBJECTS)
--------------------------------------------------------------------
- ENTITY: FinTrack (github.com/dhaatrik/expense-vs-investment-tracker)
- VERSION: v1.0.0
- SCOPE: Client-side dual ledger — expenses vs personal investments, Recharts, JSON export
- MOTIVATION: Budget apps guilt-trip growth spending; SIPs hide inside "expenses"
- KEY LESSON: My portfolio said Chart.js; the repo uses Recharts
====================================================================
```

## Mission Log: Two Ledgers, One Honest Mirror

**SYS.STATUS:** TRANSMISSION LIVE // CLEARANCE: PUBLIC

Hey. My portfolio tagged FinTrack with **Chart.js**. The repo at **v1.0.0** uses **Recharts** for area and pie charts. Small drift, easy fix — the bigger story is _why_ I split ledgers at all.

Most budget apps treat your gym membership, course fee, and mutual fund SIP the same way: money out, guilt in. FinTrack separates **depreciating spend** from **growth-oriented spending** — including personal investments in yourself — so your dashboard tells two stories, not one blurred bucket.

---

## The Why — What Problem Was I Actually Solving?

Three frustrations stacked:

1. **Investments disappeared inside expense sheets.** My SIP looked like groceries in the monthly total. Net worth trajectory was invisible next to coffee runs.

2. **Restrictive budgeting tone.** Cutting everything feels virtuous until you stop spending on health, skills, or tools that compound. I wanted language that respects **intentional growth spend**.

3. **No bank sync by design.** Linking accounts is convenient until it's another fintech holding your transaction graph. FinTrack stays **local** — your labels, your JSON backup, your device.

FinTrack is a mindful finance **mirror**, not a unicorn neobank.

---

## What FinTrack Ships — Concrete Scope

As of **v1.0.0**:

| Surface                  | What you do there                                                   |
| ------------------------ | ------------------------------------------------------------------- |
| **Dashboard**            | Expense vs investment ratios, income/expense area charts (Recharts) |
| **Transactions**         | Log income and expenses by category                                 |
| **Personal investments** | Track growth spending (courses, health, skills) separately          |
| **Savings goals**        | Progress bars toward targets                                        |
| **Settings**             | Currency, categories, light/dark mode, **JSON export/import**       |

Stack: React 19, TypeScript 5.8, Vite 6, Tailwind CSS 4, Zustand 5, Recharts, Motion, Vitest.

Persistence: **client-side** — README emphasizes local data ownership with JSON backup. `package.json` lists `express` and `better-sqlite3` but README does not document a shipped backend — treat as unused/orphan deps until wired.

**Not shipped:** Bank linking, multi-user accounts, cloud sync.

---

## Fuckups & Learnings

- **Wrong chart library on portfolio.** Chart.js → Recharts. Lesson: grep imports before tagging projects.
- **Recharts re-render lag on mobile** — my site fuckup referenced Chart.js; the real pain was filter triggers firing full chart tears on older phones. Throttle and memoize chart inputs.
- **"Investment" tagging needs examples in UI.** Abstract labels stop logging behavior.
- **Zustand persist shape needs versioning** before you rename fields in production users' localStorage.

---

## Current State & Key Artifacts

```bash
git clone https://github.com/dhaatrik/expense-vs-investment-tracker.git
cd expense-vs-investment-tracker
npm install
npm run dev
# http://localhost:3000
```

```bash
npm run test
npm run lint
npm run build
```

MIT licensed.

---

## Closing Transmission

Log expenses. Log growth spend separately. Export JSON when you care about backups. Not a fintech pitch — a clearer vocabulary for your own money.

Full scope tables: [FinTrack project page](/projects/expense-vs-investment-tracker/).